As of 2016-02-26, there will be no more posts for this blog. s/blog/pba/
Showing posts with label Google Analytics. Show all posts

I noticed there was a jump in pageviews in Google Analytics after I resumed my posting. The increased number of pageviews were from me, they were generated by post preview. It seems that I had those in the past, I wasn't aware of those.

Because I don't have huge amount of pageviews, so my own pageviews sort of affects the accuracy of statistics in a way. I wanted to exclude those pageviews, at least for a while.


The preview URI looks like:
http://[BLOG_ID]_[HASH].blogspot.com/b/post-preview?token=[TOKEN]&type=POST
Side note: the host used to be on my custom domain blog.yjl.im, now it's on blogspot.com with strange hash and blog ID.

By using filter, we can exclude those from profile.


I use relatively strict pattern, only exclude post previews. There might be some other Blogger functions under /b/.*, you can exclude more if you want.

I think those preview is valid data, I may remove the filter some time in the future. If you are a statistics freak, you may want to see how many previews per post. Although, I don't know if that number really means anything useful.

You can check with Real-Time report, but note that filter takes time to be effective:

Keep in mind that changes made to profiles may take up to a couple of hours to update in Real-Time reports. We're working on reducing this latency.

Be patience. Wait for a couple of hours after you save new filter, then click on Preview button to see if post preview shows up in report.

More than a year ago, the loading time was around 6.4 seconds, I took few steps trying to reduce it. After that, I didn't pay anymore attention to it. A new post about Site Speed in Google Analytics got me looking into page load time again, which I have known before, but didn't pay attention to it, either.

I checked out it and it reported that it is about 5.66 seconds in average in last 30 days.


There seems to be two hiccups, I believe those views were from Poland and Hungary according to the data in Map Overlay. I am not sure what the problems really are, I don't believe that's because these two countries have slow connections to Blogger's servers.


I am quite happy to those numbers, though 5.66 seconds isn't something that you can call it a huge improvement. The global mean loading time is near 7 seconds based on the chart in Google Analytics' post. My blog is better than that, though I wish mine can be faster than mean value ~3 seconds.

The distribution of page load time is shown as the following image, it looks like the pages of my blog, 85.54% are loaded within between 1 and 7 seconds. This sounds very great.


I want to continue reading this data, so I updated my Google Analytics report script [diff]. This way, I don't need to constantly log in for checking it, I only need to read the daily report generated by my script.

Since I actually didn't do anything, in fact, I added more stuff. Maybe it's just computer gets faster, Internet connection are improved, or browser works more efficient. Anyway, I hope the number keeps going smaller.

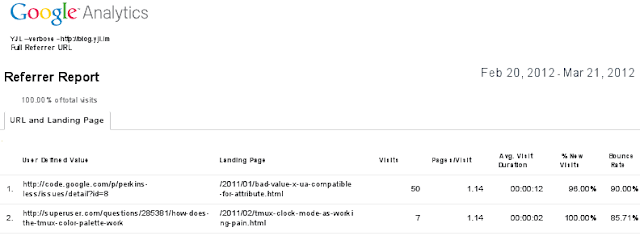
Yesterday, when I was reading my custom Full Referrer URL report, I saw an Email button (with BETA label alongside). This was added back in last November.

Out of curiosity and hopefully there would be some convenience from this feature, I decided to try it out:


Today, I got the email and realized it's an attachment (of course). There is no direct way to view within Gmail, I had to open it with a local program to view. The file format like CSV or TSV is not very friendlily human-readable, there is no alignment across columns. So I am not sure what's the point of sending this format regularly.

I doubt anyone have patience to import the file into spreadsheet for custom analysis every day. Weekly, maybe. That is only reason I can think of why you need such function. But if you do, then using API will be much smarter way to do like I do to generate my daily reports. I am just too lazy to customize one for this Full Referrer URL report which only have a few entries a day, it is not really worth my time.

After I read that announcement post, it reminded me that there is a PDF export version option. I resent the report with PDF and only once (in Frequency) to have a sneak preview. I think this is the best way to review the report, Gmail supports PDF format, you don't even need to have a local PDF viewer program. You can just view it online, awesome! This is a sample:


I reset for a new schedule for PDF version and make it active for 12 months. You can delete or edit scheduled emails from Admin Assets Scheduled Emails.

I was wandering around the settings section and found out I can not only turn off sharing on Google+ but also have Google Analytics support from Blogger. I recall I had read it long time ago on Blogger Buzz.

I want it because the pageviews from View will be also tracked. I can not touch the code of View, so this option is very helpful if I want to have complete tracking statistics. I have put View link on top of navigation bar for really long time and I probably lost some data.

I wrote my own Layout template, so it won't work by default in my own layout. It is actually very simple to have it, add the following line before </body>, e.g.
  <b:include data='blog' name='google-analytics'/>
</body>

I also removed the tracking code from my main JavaScript script, so I wouldn't have duplicate data.

This is probably the second of third time I use View mode on Blogger, not only on my blog but entire Blogger blogs. I don't really like View, it looks good and nice, but I am just not a fan of it.

Maybe because it create unique style over different blogs. I like variety, diversity of styles or layouts or designs. Pretty or ugly, doesn't matter. The important thing is the style of the blog's owner. With View, it doesn't reveal of that much.

Since I hardly check the View of my blog. I just realize there are two ads units. One at right side, the other at bottom. I roughly check with FireBug Net tab, I think they are belong to me, my Google AdSense Publisher ID, I believe. (It's long ID, but looks like mine)

As you may know, I put two ad units in my template, so I don't object for the such convenience. Just I don't see any setting options I can adjust size or location for my View. So it probably also a unique setting all over the views, I guess.

Updated at 2012-02-25T23:08:40Z: This has nothing to do with Blogger. It seems Google Analytics' tracking script will detect if you hold the account. If you do, then it shows you the interface. Here is a screenshot when I view the homepage of my blog:


When I was writing my previous post, I saw this after I hit preview button:


We found no clickthroughs for this page. Try adjusting the date range or select another page.

You got it perfectly right, Google Analytics! Because it's totally new post, how could you find click? If you do, either your are a fortune teller or something gone haywire.

But I don't mind this show up when I edit my old posts. It would be nice to know some statistics. Only it takes a few seconds to load the Google Analytics frame every time you hit preview button.

I had this idea in the end of September 2010 when I was playing with Google Analytics' tracking code. I wrote some code for rating blog posts using the option value, the code did stay on my blog for a day or two before I took it down, it wasn't too useful for me. But a function allows visitor to report page issue could be very helpful if someone is willing to click on some buttons.

I have finished a simple code and it's at bottom of this blog:


Well, it doesn't look pretty. Here is the code in that HTML/JavaScript gadget:

<script src="https://gist.github.com/raw/1713067/ga-wr.js"></script>
<script>
function init_page() {
  var gawr_options = {
    target: 'ga-wr',
    UA: 'UA-XXXXXXXX-X',
    report_options: [
      {
        title: 'Image is not loaded'
      },
      {
        title: 'Link is broken'
      },
      {
        title: 'Other'
      }
      ]
    };
  new GAWR(gawr_options);
}
$(init_page);
</script>
<div id="ga-wr"></div>

For report of issues report, I can write my own program to get daily report using my current daily report as base. But I don't think I will trouble myself, not yet anyway. Right now, I can see the report with custom report in Google Analytics:


It works great for me for now. Note that, you need to use Alert/Total Events instead of Pageviews. It's event not page. The report does get updated very quick, probably a few minutes after reported. I will say that's instant almost.

Now a little technical background of this script. Basically, you should use different profile. It will track page when a report is being submit and the report is recorded as Event. Event action is the issue name and option label is the additional information as you seen in the image above.

Option value can only accept integer, custom value probably can do the trick, but I put the data in option label. There is another way to record is to rewrite the page URL when tracking the page, but I don't like that. But this could be a benefit, rewriting url to be /original-page-url/issue and still send the event. This way, if you watch Real-time tab, you can see there is a report just comes in if you don't use separate profile.

And remember when visitor reports, page URL is recorded by page tracking, also user's browser and system and everything Google Analytics collects by default is already in the data. Isn't this awesome and brilliant? I don't even need to code for collecting such data if I need to check visitor's browser, they are just there for me to read.

Google Analytics API can do more than just website access statistics, you can set up a poll or some thing more. Imagine you let people to vote and you use visitors metric or something to prevent some degree of voting spam.

Only the data isn't public without coding and they require process.

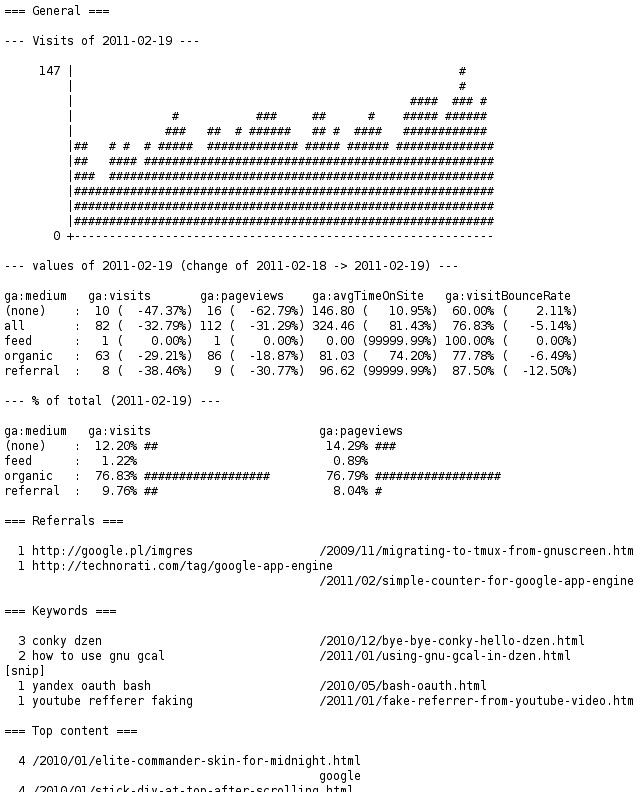
After I posted my first try of using Google Analytics Data Export API, I realized that I didnt need to send two requests for calculating visits change, one is enough. Moreover, I could also make a chart.

=== General ===

125 |                                                          #
    |                      #           ##      ##            ####
    |                      #           ###     ##     ##    #####
    | ##                  ###   ##  # ######   ## #  ####   #####
    |####  # #    # #  # #####  ############  ##### ###### ######
    |#### #####   # ## ##########################################
    |###########  ###############################################
    |########### ################################################
    |############################################################
    |############################################################
    |############################################################
  0 +------------------------------------------------------------

  116 visits (  -7.20%)
  Average time on site: 122.655172414 seconds (  55.75%)</pre>

I wonder if there is a popular Python library or common CLI tool to make an ASCII chart.

DAYS = 60
date = (dt.datetime.now() - dt.timedelta(days=1)).strftime('%Y-%m-%d')
date_start = (dt.datetime.now() - dt.timedelta(days=DAYS)).strftime('%Y-%m-%d')

# General
###########
data_query = gdata.analytics.client.DataFeedQuery({
    'ids': table_id,
    'start-date': date_start,
    'end-date': date,
    'dimensions': 'ga:date',
    'sort': 'ga:date',
    'metrics': 'ga:visits,ga:avgTimeOnSite'})
feed = my_client.GetDataFeed(data_query)
visits = [int(entry.metric[0].value) for entry in feed.entry]
max_visits = max(visits)
print '=== General ==='
print
CHART_HEIGHT = 10
VISIT_WIDTH = len(str(max_visits))
for y in range(CHART_HEIGHT, -1, -1):
  if y == CHART_HEIGHT:
    sys.stdout.write('%d |' % max_visits)
  else:
    sys.stdout.write('%s |' % (' '*VISIT_WIDTH))
  for x in range(-DAYS, 0):
    vst = visits[x]
    # vst / max_visits >= y / CHART_HEIGHT
    if vst * CHART_HEIGHT >= y * max_visits:
      sys.stdout.write('#')
    else:
      sys.stdout.write(' ')
  sys.stdout.write('\n')
  sys.stdout.flush()
print '%s0 +%s' % (' '*(VISIT_WIDTH-1), '-'*DAYS)
print
visits_change = 100.0 * (visits[-1] - visits[-2]) / visits[-2]
avg_time = float(feed.entry[-1].metric[1].value)
avg_time_before = float(feed.entry[-2].metric[1].value)
avg_time_change = 100.0 * (avg_time - avg_time_before) / avg_time_before
print '  %s visits (%7.2f%%)' % (visits[-1], visits_change)
print '  Average time on site: %s seconds (%7.2f%%)' % (avg_time, avg_time_change)
print

About a couple of weeks ago, I noticed a few strange pageviews which have URL paths did not match Blogger blog URL structure and one word particularly got my attention, atheism.

https://farm6.staticflickr.com/5298/5390875374_9af2bef60d_o.png

If you are a Blogger blogger, you will be immediately aware that definitely not come from your blog. You wont see links like /blog/ or /YYYY/MM/DD/blah in your blog. The question is where did they come from?

At first thought, I believed that site owner mistyped a digit of his1 own UA number2 or something like that. But its obviously not because the UA number very different than mine. I began to think the owner was trying to fake pageviews and drew me to check out the owners website. However, I dismissed that thought very quickly, because that website doesnt seem to fit in and usually spammers only target a subject for a very short period of time. Often its one-time spamming only, but its been at least one day when I noticed.

My index finger slowly moved to point at Google Analytics system, some big flaw in the system I would guess. Ha! I will be the first one to expose this! I ecstatically enjoyed my glorious moment. Well, that moment didnt come. I put it aside because I didnt believe Google would have such flaw, either.

Finally, I decided to check help forums to see if anyone has encountered same situation. I found one useful, the problem is I still didnt think my UA number was being used by someone. I decided to do a final check on the websites source code, which was my second time. Still got nothing.

I brought up Firefox 4s Web Control and left Net and JavaScript on only, reloaded the page and read the logs. One thing more weird came to my eyes:

https://farm6.staticflickr.com/5300/5390875336_a194a5483e_o.png

The page loaded Disqus script, its no big deal even that website doesnt use Disqus at all. The eye-bulging part is "yjlv", thats my blogs Disqus ID. I double-checked with Chromium because I just didnt believe, Chromiums Developer Tools Resources tab affirmed.

Alright, this whole thing is extremely confusing. Its as if the weirdness not only be doubled but actually is squared. Firstly, my UA number could be used by someone. And now, even Disqus? What the heck is going on? I asked myself.

I checked the source code for the third time, I still got nothing. I almost gave up and decided to write a post on help forums, then I clicked on the websites local copy of jQuery. I did the search, BINGO!

https://farm6.staticflickr.com/5058/5390875422_9d861cf646_o.png

I wouldnt believe when I saw my code was in the end of file and more than just UA number and Disqus parts, it seems to include this entirely.

I dont know which part of my code the website owner is actually using. That JavaScript is written for this blog and I doubt it would work out-of-the-box on other website. I remember somewhere I read long ago, copy-and-pasting the code you dont understand is a very bad habit. If I was a very bad person and that website does have <pre><code>...</code></pre>, then I could send a different version of highlight.pack.js if my GAE app detects the visitor is from that website. Who knows what I would put in that fake JavaScript?

Right after I publish this post, I am going to find the contact information and shoot the owner an email with a link to this post. I hope its About or Contact page isnt written in Korean.

Anyway, I am really tired of writing an email to detail everything. So, here is the message body to the website owner:

Hi!

Dont worry, you didnt violate any copyright law. Just please remove parts you dont need from your /js/jquery.js, especially the part contains my Google Analytics UA. You contributed 600+ page views into my Google Analytics report, I am really appreciated for the generosity.

Sincerely yours, P.

PS. If possible, please tell me which part of my code you intend to use? collapse_pre()?

I really dont want to write a post anytime, but I also dont want to see any more data which dont belong to me. If you are going to suggest me creating a filter for preventing from this kind of thing happened again, thanks! But no, I wont do that. Covering eyes isnt a solution.

And please readers, though I decided not to mask that websites name and domain in screenshots, but please DO NOT visit that website anytime soon, or my Google Analytics account would have more **kindly contributed* data. Besides, you know most of you guys dont read Korean right, please dont say Google Translate, I am begging you!*

[1]I assume the owner is a male.
[2]Also known as Web Property ID.

I cleaned up my cookies, probably less than 24 hours. Here is I have now:

$ sqlite3 cookies.sqlite 
SQLite version 3.6.23.1
Enter ".help" for instructions
Enter SQL statements terminated with a ";"
sqlite> select count(name) from moz_cookies where name like '\_\_ut%' escape '\';
148
sqlite> select count(name) from moz_cookies;
456

32.46% of cookies were baked by Google Analytics. I begin to think if I should find a way to block (www|ssl).google-analytics.com/ga.js. I currently doesn't have any add-on for any kind of blocking and I really don't want an add-on just for blocking one script.

So, I added

127.0.0.1 google-analytics.com www.google-analytics.com ssl.google-analytics.com

to /etc/hosts file and clean up __ut* cookies and cache. So, I wouldn't have a local copy of ga.js, it's the baker. You gotta fire him!

Don't eat too many cookies!

I have a project called BRPS, which has an old client script brps.js. Whenever this client request data from BRPS server, the server will increase the requests count and it has a statistics page for showing the count. Recently, a new client is implemented, gas.js. This new client doesnt communicate with BRPS server, I need to find a way to get a statistic number about how many requests it has been made. I dont want to write more code on my server to log those requests. So, Google Analytics is the best option for me.

1   Non-asynchronous method

function _track() {
  try {
    var pageTracker = _gat._getTracker("UA-#######-#");
    pageTracker._setDomainName("none");
    pageTracker._setAllowLinker(true);
    pageTracker._trackPageview();
    }
  catch(err) {
    }
  }
if (window._gat) {
  _track();
  }
else {
  $.getScript(('https:' == document.location.protocol ? 'https://ssl' : 'http://www') + '.google-analytics.com/ga.js', function(){
      _track();
      });
  }

With the code above, my script can track requests from different domains1, which are not mine. I didnt assign a path via pageTracker._trackPageview('/path/something'), because I want to see where exactly the request are made from. The UA-#######-# is only used by this script and I dont need to log status such as /status/success or /status/failed.

2   Filters

I created a new profile and two more based on the first one. The last two are using filter each. The first filter is

http://farm5.static.flickr.com/4145/5015391847_4ea860f041_b.jpg
Custom filter Advanced  
FieldA Hostname (.*)
FieldB Request URI (.*)
Output Request URI $A1$B1

The profile with this filter can see results like example.com/foobar. A sample output:

http://farm5.static.flickr.com/4125/5015391907_53b3980f71_z.jpg

The second one is

Custom filter Advanced  
FieldA Hostname (.*)
FieldB unused  
Output Request URI $A1

The profile with this filter can see results like example.com, I would like to know which websites are top users. A sample output:

http://farm5.static.flickr.com/4089/5016000652_460119ec27_z.jpg

3   Asynchronous method

I knew there was a method called asynchronous tracking. But I wasnt catching it when I saw the code using JavaScript Array _gaq[] to store commands. At first, I thought thats kind of bad. They embedded ga.js to read that array every time? Did script clean it up?

I was wrong until I read this:

When Analytics finishes loading, it replaces the array with the _gaq object and executes all the queued commands. Subsequent calls to _gaq.push resolve to this function, which executes commands as they are pushed.

So, my _track() needs a little modification:

function _track() {
  var _gaq = window._gaq || [];
  _gaq.push(['_setAccount', 'UA-#######-#']);
  _gaq.push(['_setDomainName', 'none']);
  _gaq.push(['_setAllowLinker', 'true']);
  _gaq.push(['_trackPageview']);
  if (!window._gaq)
    window._gaq = _gaq;
  }

4   Updates

  • 2010-09-25T23:48:40+0800: Add Asynchronous method section

[1]http://www.google.com/support/analytics/bin/answer.py?answer=55503 is gone.

A standard asynchronous Google Analytics tracking code would look like:

<script type="text/javascript">

  var _gaq = _gaq || [];
  _gaq.push(['_setAccount', 'UA-#######-#']);
  _gaq.push(['_trackPageview']);

  (function() {
    var ga = document.createElement('script'); ga.type = 'text/javascript'; ga.async = true;
    ga.src = ('https:' == document.location.protocol ? 'https://ssl' : 'http://www') + '.google-analytics.com/ga.js';
    var s = document.getElementsByTagName('script')[0]; s.parentNode.insertBefore(ga, s);
  })();

</script>

I didnt like how they look, so I decided to re-write with jQuery:

if (window._gat) {
  _gat._getTracker("UA-#######-#")._trackPageview();
  }
else {
  $.ajaxSetup({cache: true});
  $.getScript(('https:' == document.location.protocol ? 'https://ssl' : 'http://www') + '.google-analytics.com/ga.js', function () {
      _gat._getTracker("UA-#######-#")._trackPageview();
      });
  $.ajaxSetup({cache: false});
  }

It checks if there already is a Google Analytics script included. The script is the same and reusable, some websites might have multiple tracking code being executed. There is no need to create many <script>. If the script isnt included, then it loads it using jQuerys getScript(). Within the callback, it logs the pageview. You might also want to put _gat... into a try {} catch.... The older non-asynchronous tracking code does that.

You can also see it uses $.ajaxSetup() to set up cache use. By default, jQuery appends a timestamp like _=1234567890 as a query parameter after the URL of the script you want to load, that timestamp is called cachebuster, which causes web server sends same content to client even the content isnt modified. I discovered this behavior when I was adding new code on this blog.

In normal request, your web browser will check with server. If server returns 304, then browser will use the ga.js it already has in hand. With cachebuster, that wont happen, browser receives same content again and again. Using ajaxSetup() is to ensure cache is in use.

The only part I dont like in my code is how it decides the script link, it doesnt look pretty to me.

Google Analytics team keeps making many new features. I just checked out my account:


It's embarrassing to show everyone this single digit of views, obviously, I didn't run my blogs well or write a popular codes. This can be treated as positive, keep working until I get hot!

Anyway, I like this new Overview, you now only need to take a glance to know a general statistics of your sites without checking them one by one. Maybe the team would add custom fields feature, which allows you listing any data you would like to see in Overview.